Fear & Greed at 13, Yet Bitcoin Holds $69K: What ETF and Strategy Flows Tell Us About the BTC-XRP Divergence
Bitcoin holds the $69K level in extreme fear because ETF and Strategy flows are supporting the floor. XRP has not demonstrated the same structural resilience

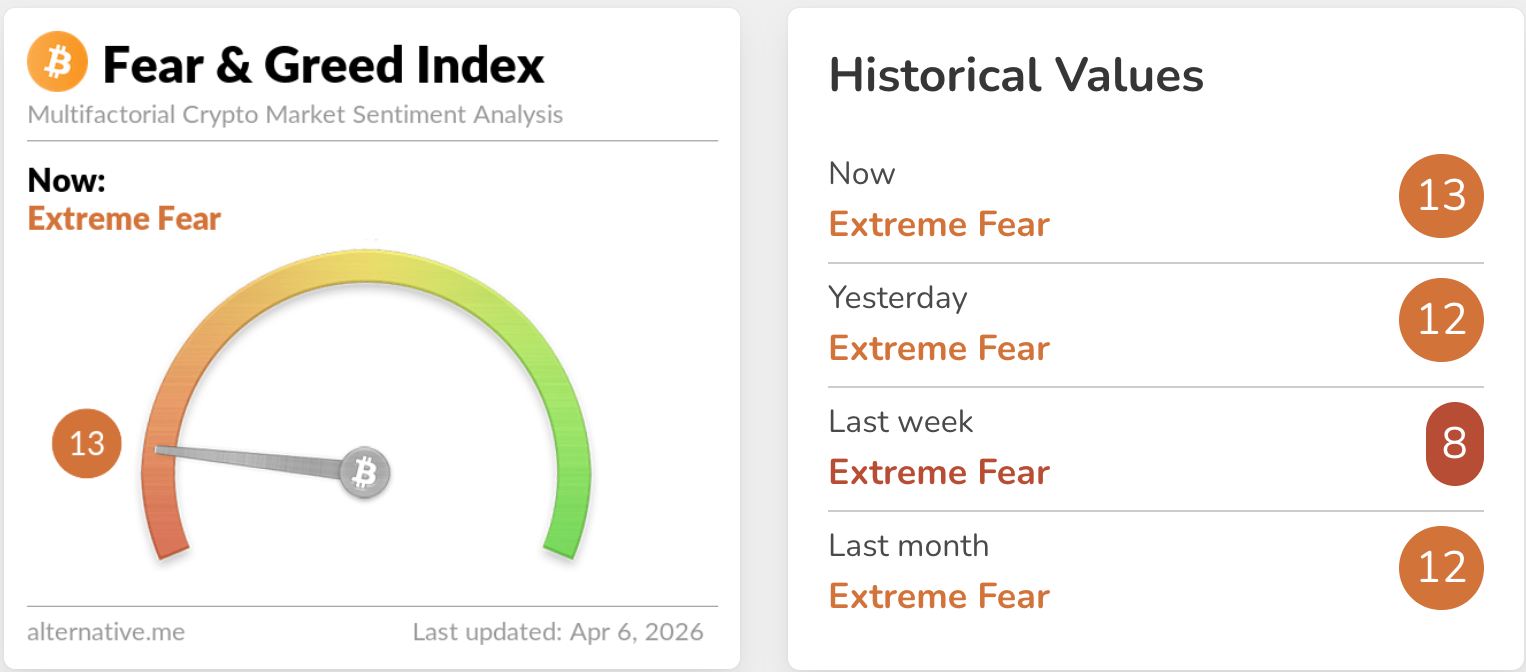
Bitcoin is holding the $69,000 level despite the Crypto Fear & Greed Index sitting at 13 — deep in "extreme fear" territory — because institutional-grade demand is supporting the market from below. Over the past 30 days, U.S. spot BTC ETFs absorbed roughly 50,000 BTC while Strategy added approximately 44,000 BTC, bringing its total holdings to 762,099 BTC. Meanwhile, XRP has failed to demonstrate the same structural resilience: ETF inflows have slowed, daily net outflows have appeared, and active addresses have dropped 45% from March highs. This is not a market where everything moves together. It is a market where the order of absorption matters — and right now, the ledger says Bitcoin is first in line.
This analysis addresses three questions. First, why are fear and price decoupling? Second, what makes Bitcoin's rebound structurally different from a sentiment-driven rally? Third, why is XRP unable to match Bitcoin's recovery despite operating in the same macro environment?
Data Box ①
| Category | Metric | Value |
|---|---|---|
| Sentiment | Crypto Fear & Greed Index | 13 — Extreme Fear |
| Macro | WTI Crude | $114.57 — post-Trump Iran ultimatum |
| BTC Supply | Spot ETF 30-day absorption | ~50,000 BTC |
| BTC Supply | Strategy 30-day accumulation | ~44,000 BTC / Total: 762,099 BTC |
| BTC Demand | 30-day apparent demand growth | Approx. -63,000 BTC — deep contraction |
| XRP ETF | Cumulative net inflow | ~$1.21B / recent daily net outflows observed |
| XRP On-chain | Active addresses | ~14,400 — down 45% from March peak of ~26,400 |
INTERPRETATION Bitcoin is not rallying because conditions have improved. It is declining less than expected because structural buying persists beneath the surface. XRP retains some institutional footprint, but the evidence for sustained structural demand remains thin relative to Bitcoin.
IMPLICATION The task for investors right now is not to predict direction. It is to distinguish which assets have confirmed structural demand and which are still in the expectation stage.
1. Why Are Fear and Price Moving in Opposite Directions?
The first misconception is that extreme fear must produce an immediate price collapse. In a market dominated by retail speculation, that assumption holds reasonably well. But Bitcoin has evolved. It is no longer a purely sentiment-driven asset — it is increasingly a structurally accessible asset with regulated entry points for institutional capital. The Fear & Greed Index captures crowd psychology, but it does not directly reflect the accumulation velocity inside ETF accounts and corporate balance sheets. That gap is precisely where the decoupling originates. Sentiment can freeze while structural buying continues.
The current Middle East escalation makes this dynamic more visible. According to Reuters, President Trump publicly threatened to strike Iranian power infrastructure and bridges unless the Strait of Hormuz was reopened, pushing WTI crude toward $114.57. Despite OPEC+ signaling production increases, the market priced in tangible supply disruption risk. This combination is conventionally negative for risk assets. Yet Bitcoin did not collapse. At minimum, this indicates that part of the market treated the shock as a short-term macro headwind while using the dip as a buying opportunity. Bitcoin is currently an asset that reacts to fear and, simultaneously, an asset that gets accumulated during fear.
An important distinction is necessary here. Framing this as "Bitcoin has become a safe haven" overstates the case. Bitcoin is not behaving like gold — automatically bid during crises. It is behaving more like a scarce asset accessible through regulated channels, one where downside buyers exist even under stress. A more accurate description is "a risk asset that sits on balance sheets," rather than a safe haven. Understanding this difference is what separates a structural reading of the current rebound from naive optimism.
2. The Real Driver of This Rebound Is the Ledger, Not the Headlines
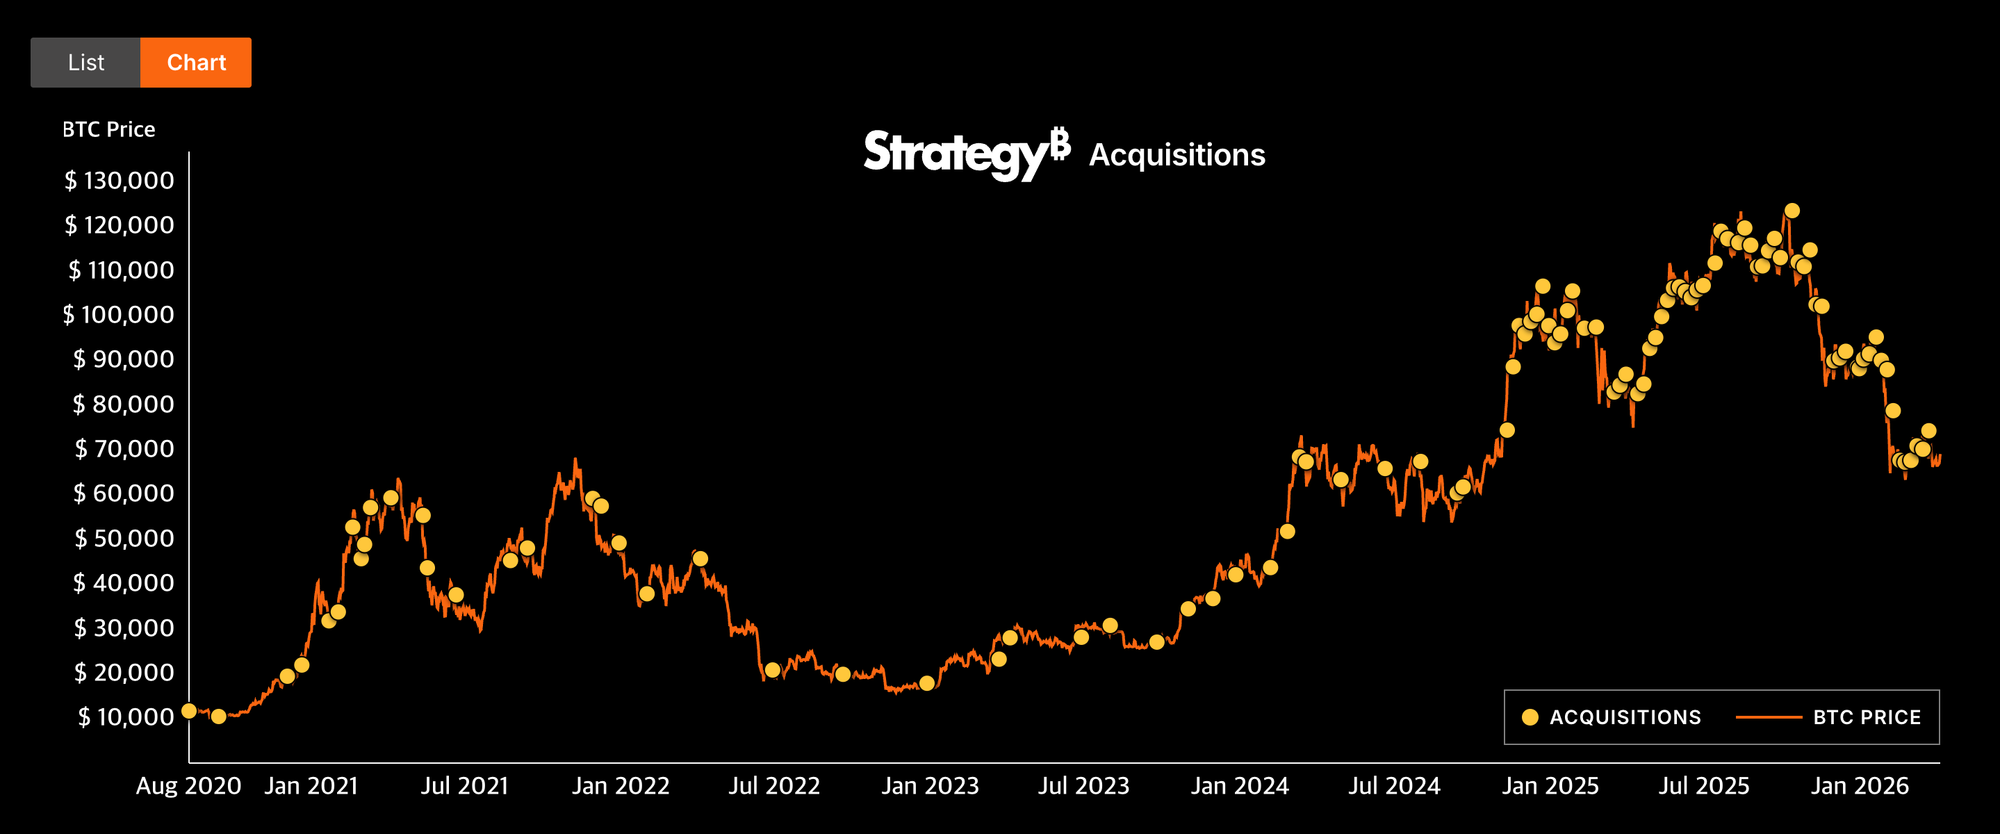
CoinDesk data shows that over the past 30 days, U.S. spot Bitcoin ETFs absorbed approximately 50,000 BTC. In the same period, Strategy accumulated roughly 44,000 BTC, bringing its disclosed holdings to 762,099 BTC. Combined, that is approximately 94,000 BTC removed from the available supply in a single month. These are not mood indicators. They are the most important ledger entries for understanding why Bitcoin is not breaking down under macro pressure.
The argument that Bitcoin's market structure has fundamentally changed draws its strength from exactly this data. In previous cycles, rising fear led directly to cascading liquidations and price destruction. Fear is still present among retail and short-term participants, but ETFs and corporate treasury strategies now constitute a standing buy channel. This channel may not automatically become more aggressive when prices fall, but it does not move in perfect lockstep with retail panic either. That is why news is frightening and sentiment is frozen, yet the price declines less than expected. Bitcoin can no longer be explained solely as "the sum of market sentiment." It must be explained as "market sentiment plus an institutional acquisition pipeline."
However, a common misinterpretation must be addressed. The fact that ETFs and Strategy are buying does not automatically mean a bull market has resumed. CryptoQuant's April 1 research makes this point directly: despite accelerating ETF and Strategy purchases, overall Bitcoin spot demand remains in "deep contraction." The 30-day apparent demand growth stood at approximately -63,000 BTC. The implication is straightforward — institutional capital is buying, but selling pressure from other participants exceeds that buying. This is why the rebound feels heavy and why declaring a trend reversal remains premature.
This data defines the character of the current rebound. It is not a rebound driven by broad-based optimism. It is a rebound sustained by structural buying that prevents the price from collapsing as far as sentiment alone would dictate. The distinction is critical for investment decisions. The first interpretation leads to chasing. The second leads to checkpoint-based positioning. What is needed now is not a bull market declaration but confirmation of how far the structural buffer can hold.
Data Box ②
| Category | Metric | Significance |
|---|---|---|
| BTC Institutional Buying | ETF + Strategy combined ~94,000 BTC (30 days) | Active structural demand supporting the floor |
| BTC Spot Demand | Apparent demand growth ~-63,000 BTC | Retail/other selling exceeds institutional buying |
| Interpretation | Structure holds, but trend reversal unconfirmed | Checkpoint-based approach, not bull market declaration |
3. Why Scenarios Should Be Treated as Conditions, Not Predictions
Two paths are currently open, and neither can be dismissed.
The first is a scenario in which Middle East tensions de-escalate, oil prices stabilize, and Bitcoin's current rebound extends further. In this case, ETF and corporate buying would transition from a buffer to a foundation for trend recovery. As geopolitical risk premiums decline, risk asset discount rates shrink, and Bitcoin's existing structural buy base could produce a more elastic recovery than the current sentiment would suggest. Reuters reporting on negotiation signals from the Trump administration indicates this scenario is not entirely implausible.
The second is a scenario in which the oil shock and geopolitical risk persist, spot demand contraction continues, and the current rebound proves to be a range-bound retracement rather than the start of a new trend. In this case, ETF and Strategy buying would function as a shock absorber — slowing the decline rather than reversing it. The structure holds, but the trend does not turn. This is the most fatiguing state for investors: a market that seems to improve but cannot be trusted, and seems to break but refuses to collapse.
The relevant question is therefore not which forecast sounds more convincing. It is which indicators, moving in which direction, should trigger a revision of interpretation. Four checkpoints matter most. First, whether oil prices spike further or stabilize. Second, whether Hormuz-related geopolitical risk de-escalates. Third, whether ETF weekly net inflows remain positive — a flip to negative would undermine the core "institutions are supporting the floor" thesis. Fourth, whether CryptoQuant's spot demand contraction narrows. The first two are macro conditions; the latter two are crypto-internal conditions. Both domains must be monitored simultaneously.
4. Why Does XRP Feel Heavier Despite Operating in the Same Market?
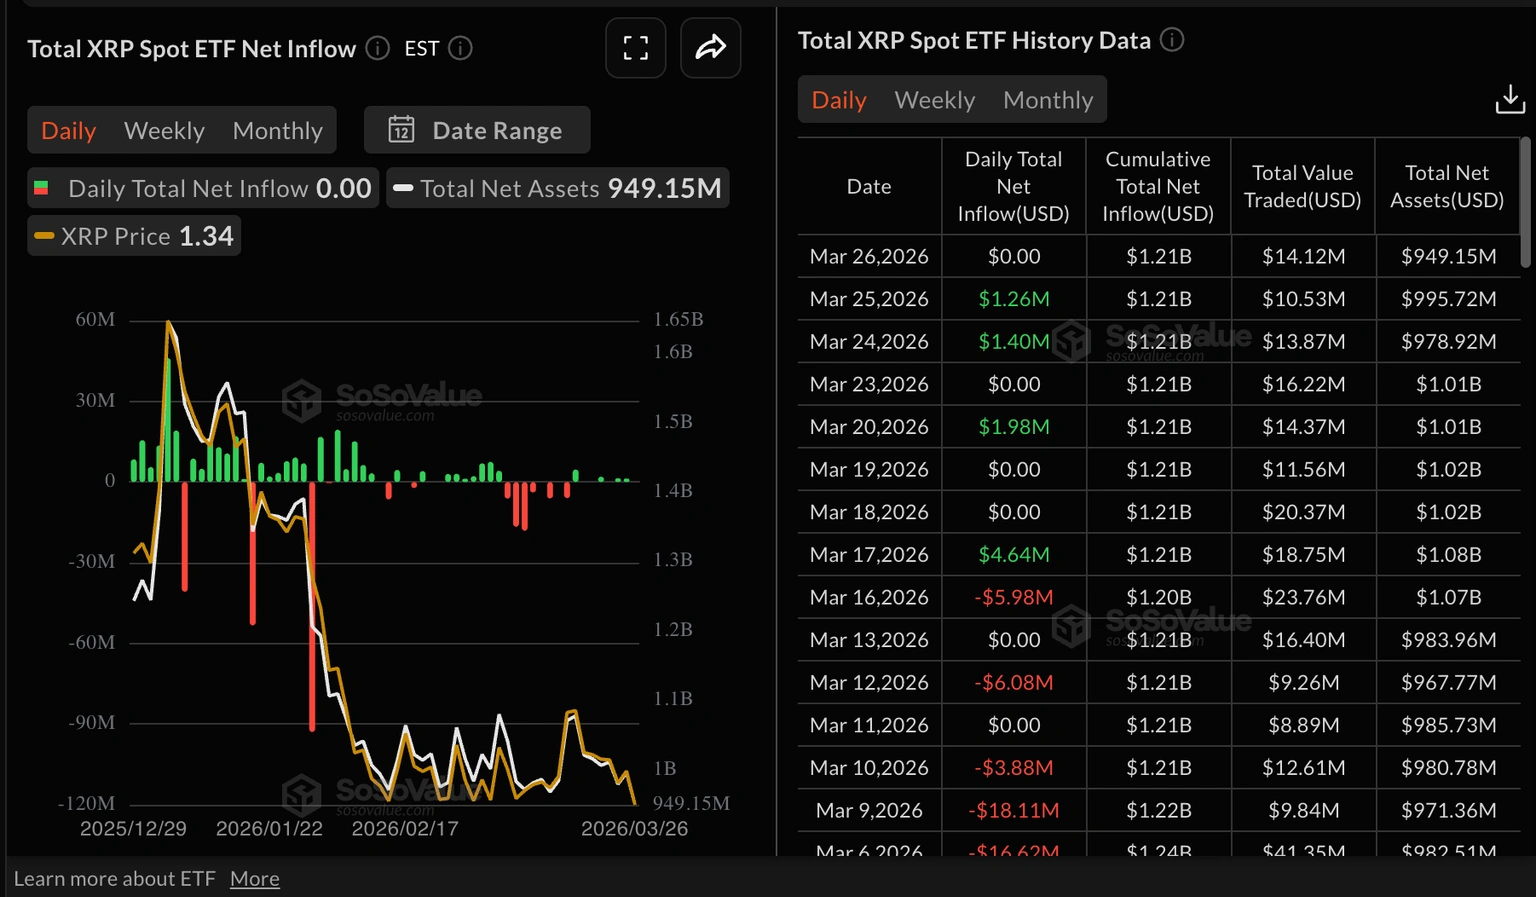
XRP is not devoid of institutional attention. FXStreet, citing SoSoValue data, reports that cumulative inflows into U.S.-listed XRP spot ETFs stand at approximately $1.21 billion. That figure is not trivial. The problem, however, is not the level — it is the velocity and persistence. Recent flow patterns have been sluggish. On March 31 alone, a daily net outflow of roughly $2.3 million was recorded. Total ETF net assets have contracted from approximately $1.65 billion at the start of the year to around $949 million. Capital has not vanished entirely, but the heat is dissipating.
On-chain metrics reinforce this reading. According to FXStreet, XRP active addresses have declined to approximately 14,400, a significant drop from the March peak of roughly 26,400. When ETF inflows are strong, on-chain activity is rising, and derivatives participation is expanding, an asset typically builds "trend-level demand." XRP is currently not exhibiting any of these three pillars simultaneously. All three are lukewarm. This is not merely a case of price suppression — it signals that the asset has not yet recaptured priority within the broader market's allocation hierarchy.
The divergence between Bitcoin and XRP is therefore not simply a market-cap difference. Bitcoin has ETFs and corporate treasury programs functioning as explicit, ongoing acquisition mechanisms. XRP has an ETF channel, but insufficient evidence that this channel operates as a sustained absorption device. Bitcoin has a relatively clear answer to "why is someone buying this even during fear." XRP does not yet have an answer of comparable strength to "why should strong capital return here now."
Institutional narrative adds another layer. Forbes reports that Standard Chartered cut its XRP price target from $8 to $2.80 this year. A single price target does not determine an asset's future. But the message matters more than the number: institutions are re-evaluating XRP not as a "must-own core holding" but as a high-volatility asset sensitive to rates, ETF flows, and macro conditions. This suggests XRP has entered a phase where expectation alone is insufficient to drive price.
Data Box ③
| Category | Metric | Value / Status |
|---|---|---|
| XRP ETF | Cumulative net inflow | ~$1.21B — but recent deceleration + daily outflows |
| XRP ETF | Net asset value | ~$1.65B (Jan) → ~$949M (current) |
| XRP On-chain | Active addresses | ~14,400 — down 45% from March peak |
| Institutional View | SC price target revision | $8 → $2.80 (65% cut) |
| Interpretation | Capital exists but momentum is fading | BTC-level structural buying not yet confirmed for XRP |
5. What Investors Should Watch Is Not the Rebound — It Is the Sequence
Labeling XRP a "finished asset" would also be inaccurate. A more revealing data point suggests the opposite conclusion. The 2026 EY-Parthenon and Coinbase institutional survey, published in March 2026 and covering 352 institutional investors globally, found that 73% plan to increase their crypto allocations this year, and roughly two-thirds already hold exposure via spot ETPs. Institutional capital is entering the broader market. This means XRP's challenge cannot be reduced to "institutions don't care about altcoins." The more precise framing is that institutions are entering, but XRP is not currently positioned as a top-priority beneficiary of that capital. This distinction explains the relative underperformance more precisely than any single-factor narrative.
Two attitudes are most dangerous in the current environment. The first is the automatic assumption that "Bitcoin is holding, so alts will follow." The second is the premature conclusion that "XRP is stuck, therefore it's over." Both misread the current structure. What matters now is not direction — it is sequence. Which assets are being absorbed first, and which remain in the queue. Bitcoin is at the front. XRP is not yet there.
Understanding this sequence changes strategy. Bitcoin is most likely to respond first when macro variables and supply data improve simultaneously. XRP requires a different trigger set: ETF flow re-acceleration, on-chain activity recovery, and derivatives market re-engagement. Bitcoin responds to "broad risk appetite recovery." XRP likely needs "broad risk appetite plus asset-specific momentum recovery" simultaneously. That gap is the stamina gap.
Ultimately, what is needed is not the magnitude of emotion but the precision of distinction. Assuming only decline because fear is high can be wrong. Declaring trend reversal because price is holding can also be wrong. The more important task is verifying which assets are actually being absorbed right now. The data so far says the evidence is reasonably clear for Bitcoin and still limited for XRP. That is the most honest frame for reading this market.
Conclusion
This market is not an anomaly where "prices rise despite fear." It is a market where extreme fear coexists with structural buying channels, and that combination produces a floor rather than a freefall. Bitcoin has secured that structure through ETFs and Strategy's corporate treasury program. XRP has gained an institutional entry point, but the evidence that this entry point has converted into sustained trend-level demand remains insufficient. The two assets occupy the same market but move at different speeds with different structural endurance.
The core task for investors is therefore not prediction but identification. Oil direction, geopolitical developments, ETF flow persistence, spot demand contraction, XRP ETF re-acceleration, active address recovery — these checkpoints, monitored together, reveal "what is being absorbed first." This is not a time when everything moves together. It is a time when sequence matters. And the ledger, as it stands, places Bitcoin at the front of that sequence and XRP still awaiting further confirmation.
FAQ
Q1. Can Bitcoin rally when the Fear & Greed Index is at 13? Yes. The Fear & Greed Index measures crowd sentiment, but it does not directly capture structural flows such as ETF accumulation and corporate treasury buying. Bitcoin currently exists in a state where sentiment is cold but the ledger is less cold.
Q2. Does ETF and Strategy buying mean a bull market has started? Not necessarily. CryptoQuant notes that overall Bitcoin spot demand remains in deep contraction despite institutional accumulation. Institutional buying can support the floor without immediately reversing the broader trend.
Q3. Are institutions completely ignoring XRP? That would be an overstatement. Cumulative ETF inflows stand at roughly $1.21 billion, and broader institutional surveys confirm plans to expand crypto allocations. However, recent ETF flow deceleration, on-chain cooling, and muted derivatives activity suggest XRP has not yet secured the same priority as Bitcoin in institutional allocation decisions.
Q4. How far should this rebound be trusted? At this stage, checkpoints matter more than conviction. The four variables to monitor: oil price trajectory, geopolitical de-escalation progress, weekly ETF net inflow sign, and spot demand contraction trend. A flip in ETF weekly flows to net negative would directly challenge the structural support thesis.
Source Table
| Tier | Source | Usage | Link |
|---|---|---|---|
| Primary | CryptoQuant | BTC spot demand contraction data, institutional flow analysis | Research |
| Primary | CoinDesk | ETF and Strategy BTC acquisition data | Report |
| Primary | FXStreet | XRP ETF inflows/outflows, on-chain active addresses, derivatives data | Report ① · Report ② |
| Primary | Reuters | Trump's Iran ultimatum, Hormuz risk, WTI crude | Report |
| Secondary | Strategy (fmr. MicroStrategy) | BTC holdings disclosure (762,099 BTC) | Disclosure |
| Secondary | Alternative.me | Crypto Fear & Greed Index | Index |
| Secondary | Forbes | Standard Chartered XRP target cut ($8 → $2.80) | Report |
| Contextual | Coinbase / EY-Parthenon | 2026 institutional survey (352 institutions, 73% planning increased crypto allocation) | Survey |
This content is not investment advice. All investment decisions and their consequences are the sole responsibility of the individual investor.
![[마켓 분석] 비트코인 8만 달러 앞에서 멈춘 시장](https://storage.ghost.io/c/8c/af/8caf2296-06bf-4501-ae99-5e72cb676b76/content/images/size/w600/2026/04/63d9df35-5d28-48fe-9a7a-3f651c82aafe.png)