The Market Is Bleeding Out — But Money Keeps Flowing Into XRP

Crypto funds just posted their fifth straight week of outflows, totaling $4 billion. Yet XRP keeps attracting capital. Here's what that contradiction actually means.
In the last week of February, XRP is hovering around $1.35 — down 61% from its July 2025 all-time high of $3.66. It's been falling for five months straight, shedding 50% of its value since October. The chart is tightening. Volume is drying up. Money is leaving the market.
And yet, something curious is happening.
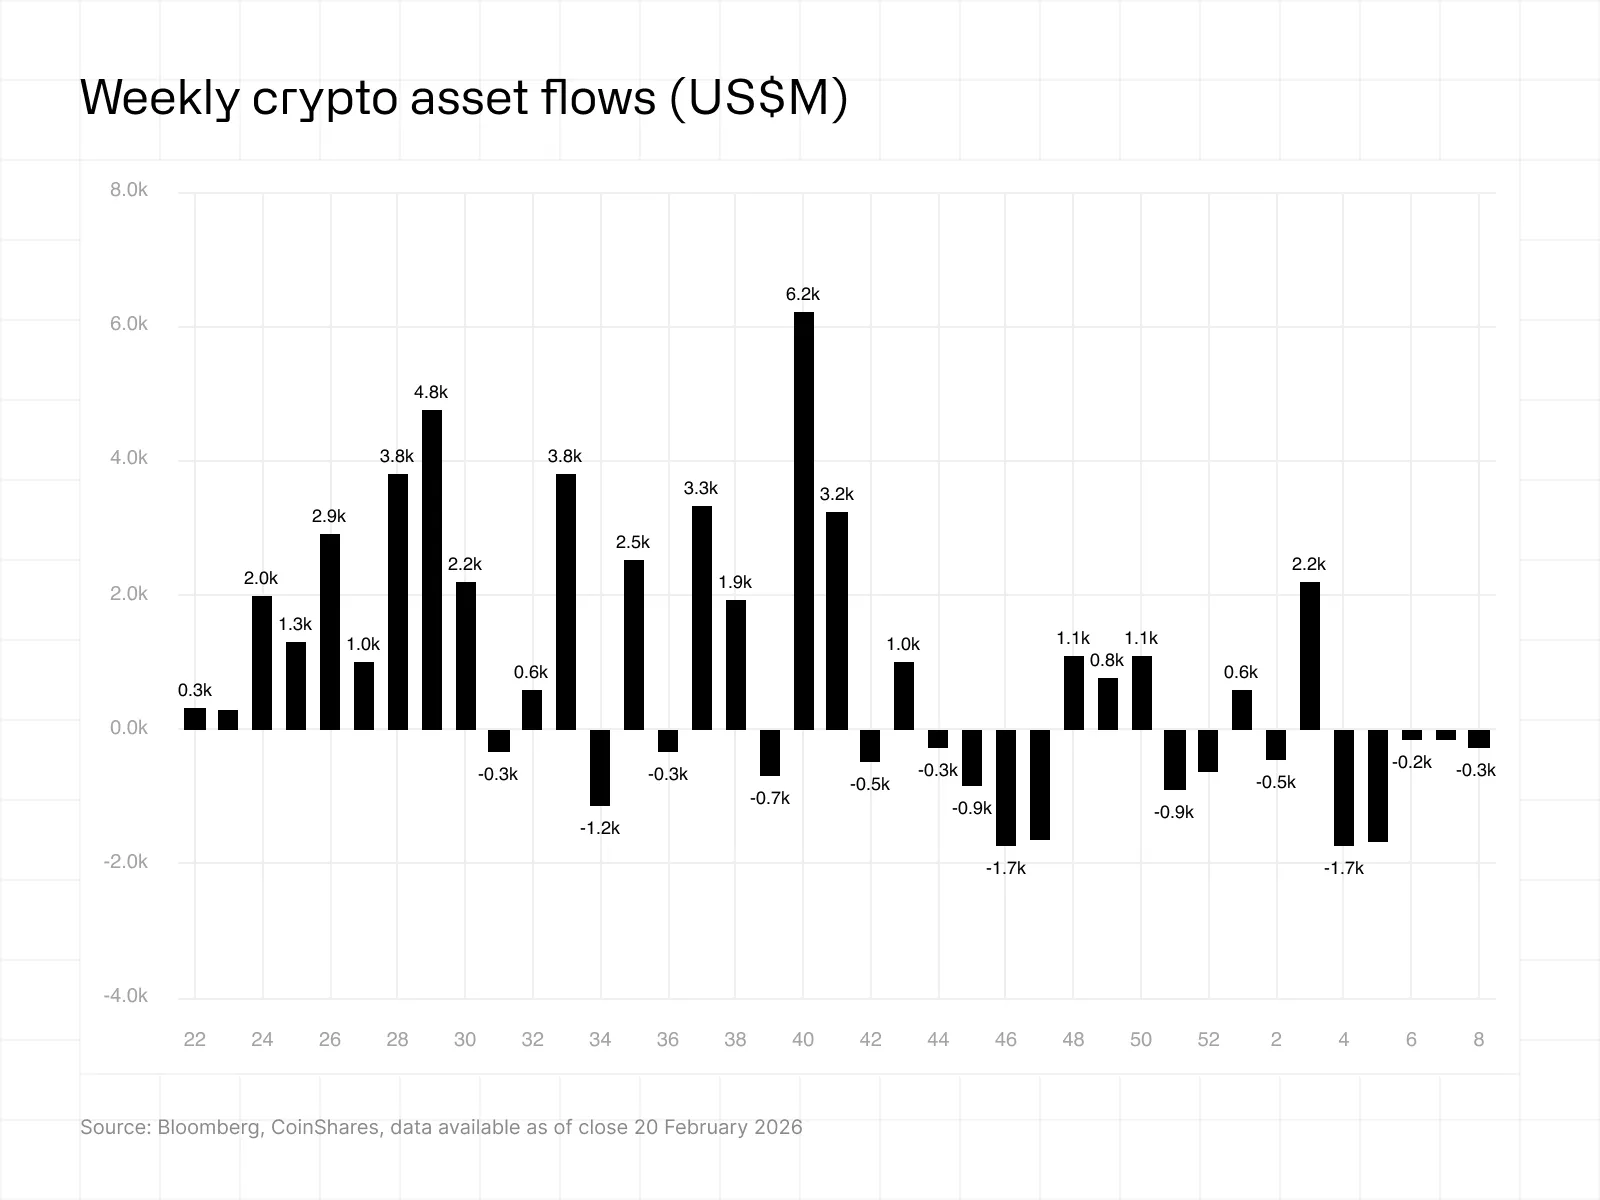
According to CoinShares' latest weekly report, digital asset investment products have now seen five consecutive weeks of outflows, totaling $4 billion. Bitcoin is bleeding. Ethereum is bleeding. But XRP? XRP is still taking in money. It's moving in the opposite direction from virtually everything else.
This essay traces that contradiction. Not just "why is XRP getting inflows?" — but what the simultaneous state of capital flows, technical structure, and market psychology tells us about where things stand. The conclusion isn't a price target. It's a set of conditions that, once met, would change the calculus.
1. What Five Straight Weeks of Outflows Actually Tells Us
The headline number from CoinShares is clear enough: $288 million in net outflows from digital asset investment products last week. Five weeks running. $4 billion cumulative.
But to read those numbers properly, you need context.
First, consider what "five consecutive weeks" means. One or two weeks of outflows is normal market correction territory. A specific event — a rate decision, a regulatory scare, a major hack — triggers a temporary pullback, and money tends to return once the dust settles. We saw this pattern multiple times throughout 2024 and 2025. But five weeks in a row is qualitatively different. This isn't a reaction to a single event. It's a shift in the default stance of market participants. "Reduce first, ask questions later" has become the baseline.
Second, look at what's happening to trading activity. The same report notes that crypto-related trading volume dropped to $17 billion — the lowest since July 2025. This matters because when outflows and declining activity happen simultaneously, the market's overall energy is dropping. Money isn't just leaving; the money that remains isn't moving. There's an important distinction between a market that lacks capital and a market where capital has gone dormant. This is the latter.
Third, CoinShares itself offers a useful qualifier. The firm notes that the $4 billion in cumulative outflows over five weeks is still below the $6 billion recorded over the same timeframe last year. So the intensity of selling is weaker than it was in early 2025. This creates an interpretive fork: you can read it as "we're not in panic territory yet" or as "the direction is still firmly outward." Both readings are valid, and that ambiguity itself is informative.
Taken together, the current market state looks less like fear and more like apathy. Participants aren't aggressively selling so much as they're failing to find reasons to aggressively buy. In that kind of environment, any asset that's still attracting inflows stands out — not necessarily as a bullish signal, but as evidence that a separate thesis is at work.
2. Dissecting the XRP Inflows — What the Numbers Actually Show
Now let's look at what's actually happening with XRP.
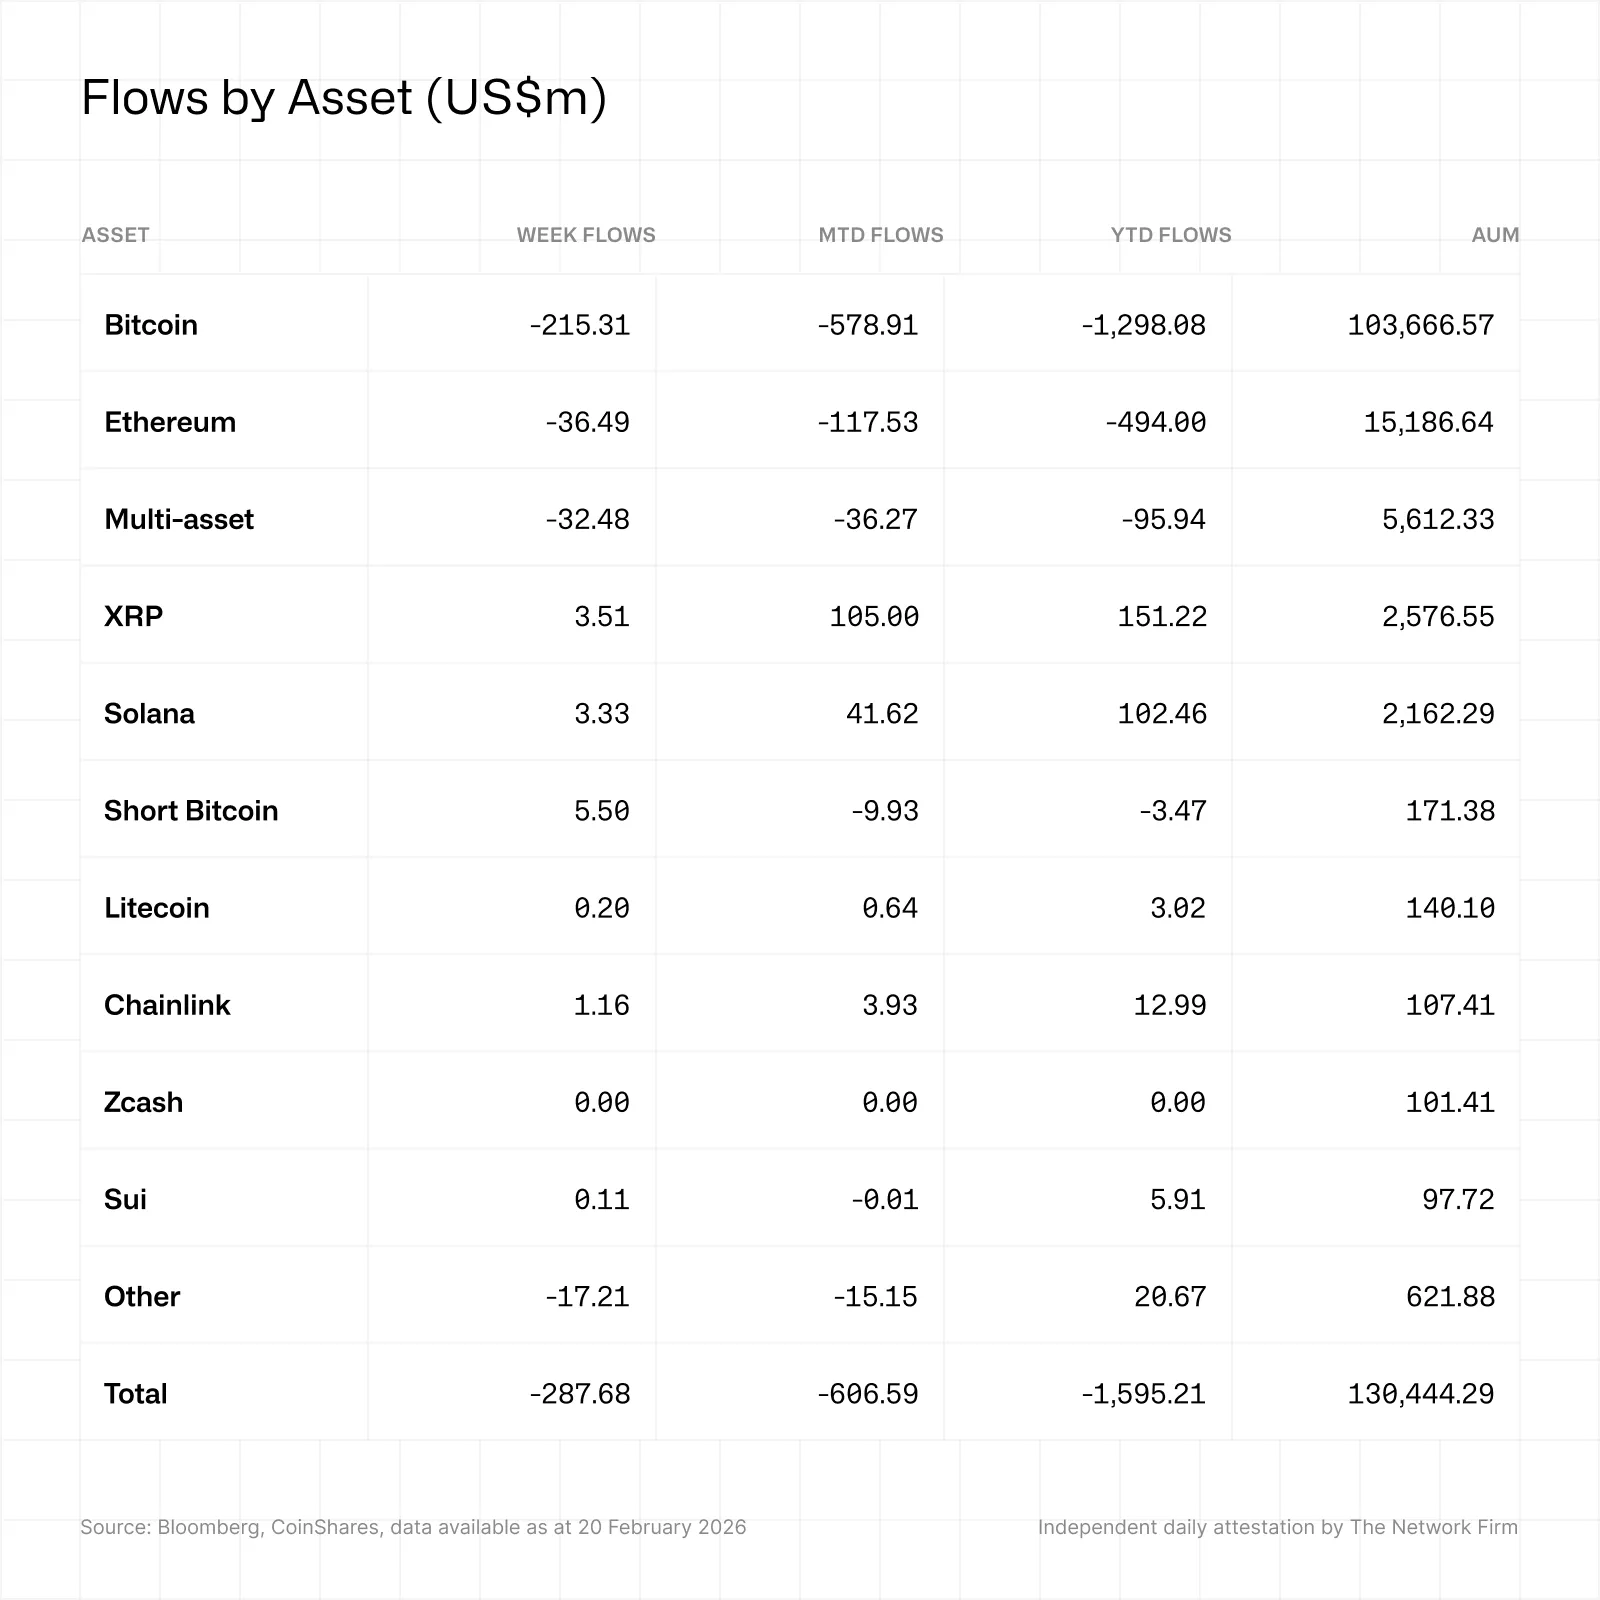
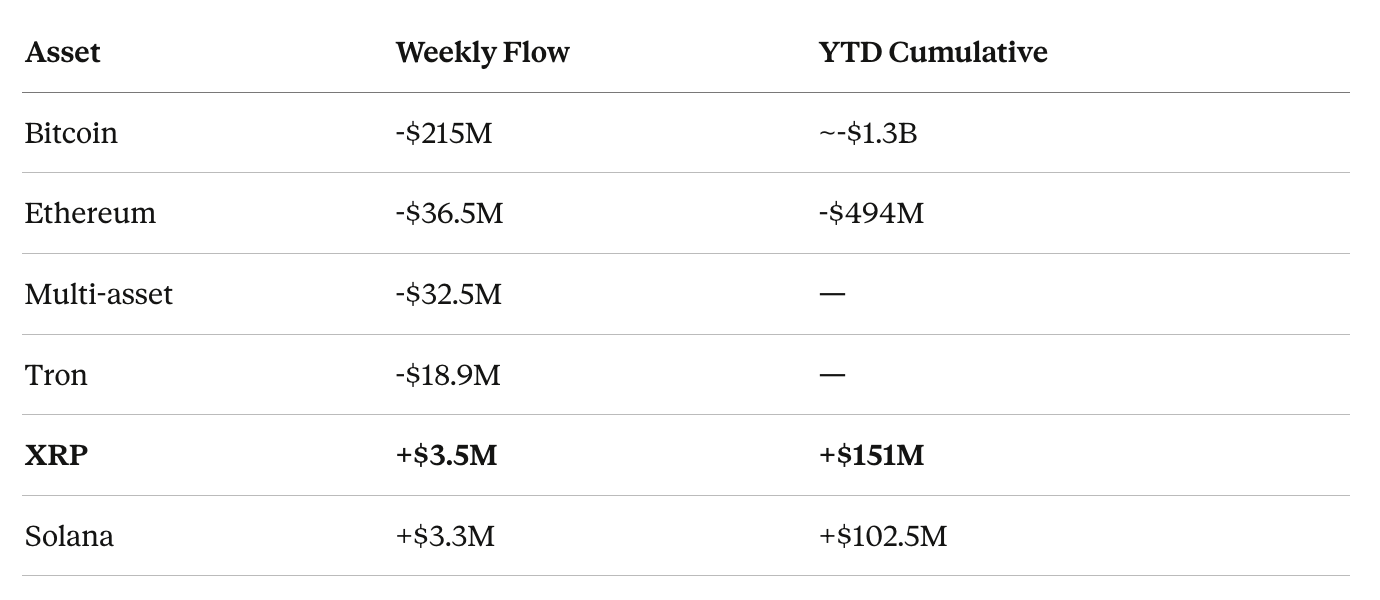
Per CoinShares, here's how the major assets stacked up last week:
Several observations follow from this.
Observation 1: The absolute size of XRP inflows is small, but the directional consistency is the signal. $3.5 million is just 1.6% of Bitcoin's weekly outflow. This isn't enough money to move markets or drive price action on its own. But the point isn't scale — it's direction. In an environment where the entire market has been bleeding for five straight weeks, XRP has maintained positive flow every single time. Last week's $3.5 million was down from $33.4 million the week before, so the magnitude is fading. But the sign hasn't flipped.
Observation 2: The year-to-date cumulative is the more meaningful figure. XRP's YTD inflow of $151 million, with $105 million of that coming this month alone, suggests sustained positioning rather than one-off trades. What makes this particularly notable is that XRP's price has been declining throughout this period. Capital flowing into a falling asset can mean one of two things: bottom-fishing by value-oriented allocators, or pre-positioning ahead of an anticipated catalyst (ETF approval, regulatory clarity, institutional adoption milestones). Either way, it represents a logic distinct from simple momentum-chasing.
Observation 3: XRP isn't alone — Solana shows a similar pattern. Solana also posted $3.3 million in weekly inflows, with a YTD total of $102.5 million. This suggests that what we're seeing isn't "XRP is special" so much as "institutions are selectively maintaining exposure to specific altcoins while de-risking from BTC and ETH." This looks more like portfolio rebalancing than a single-asset conviction trade.
The Geographic Split: No Consensus Anywhere
Layer in the regional data and the picture gets more complicated.
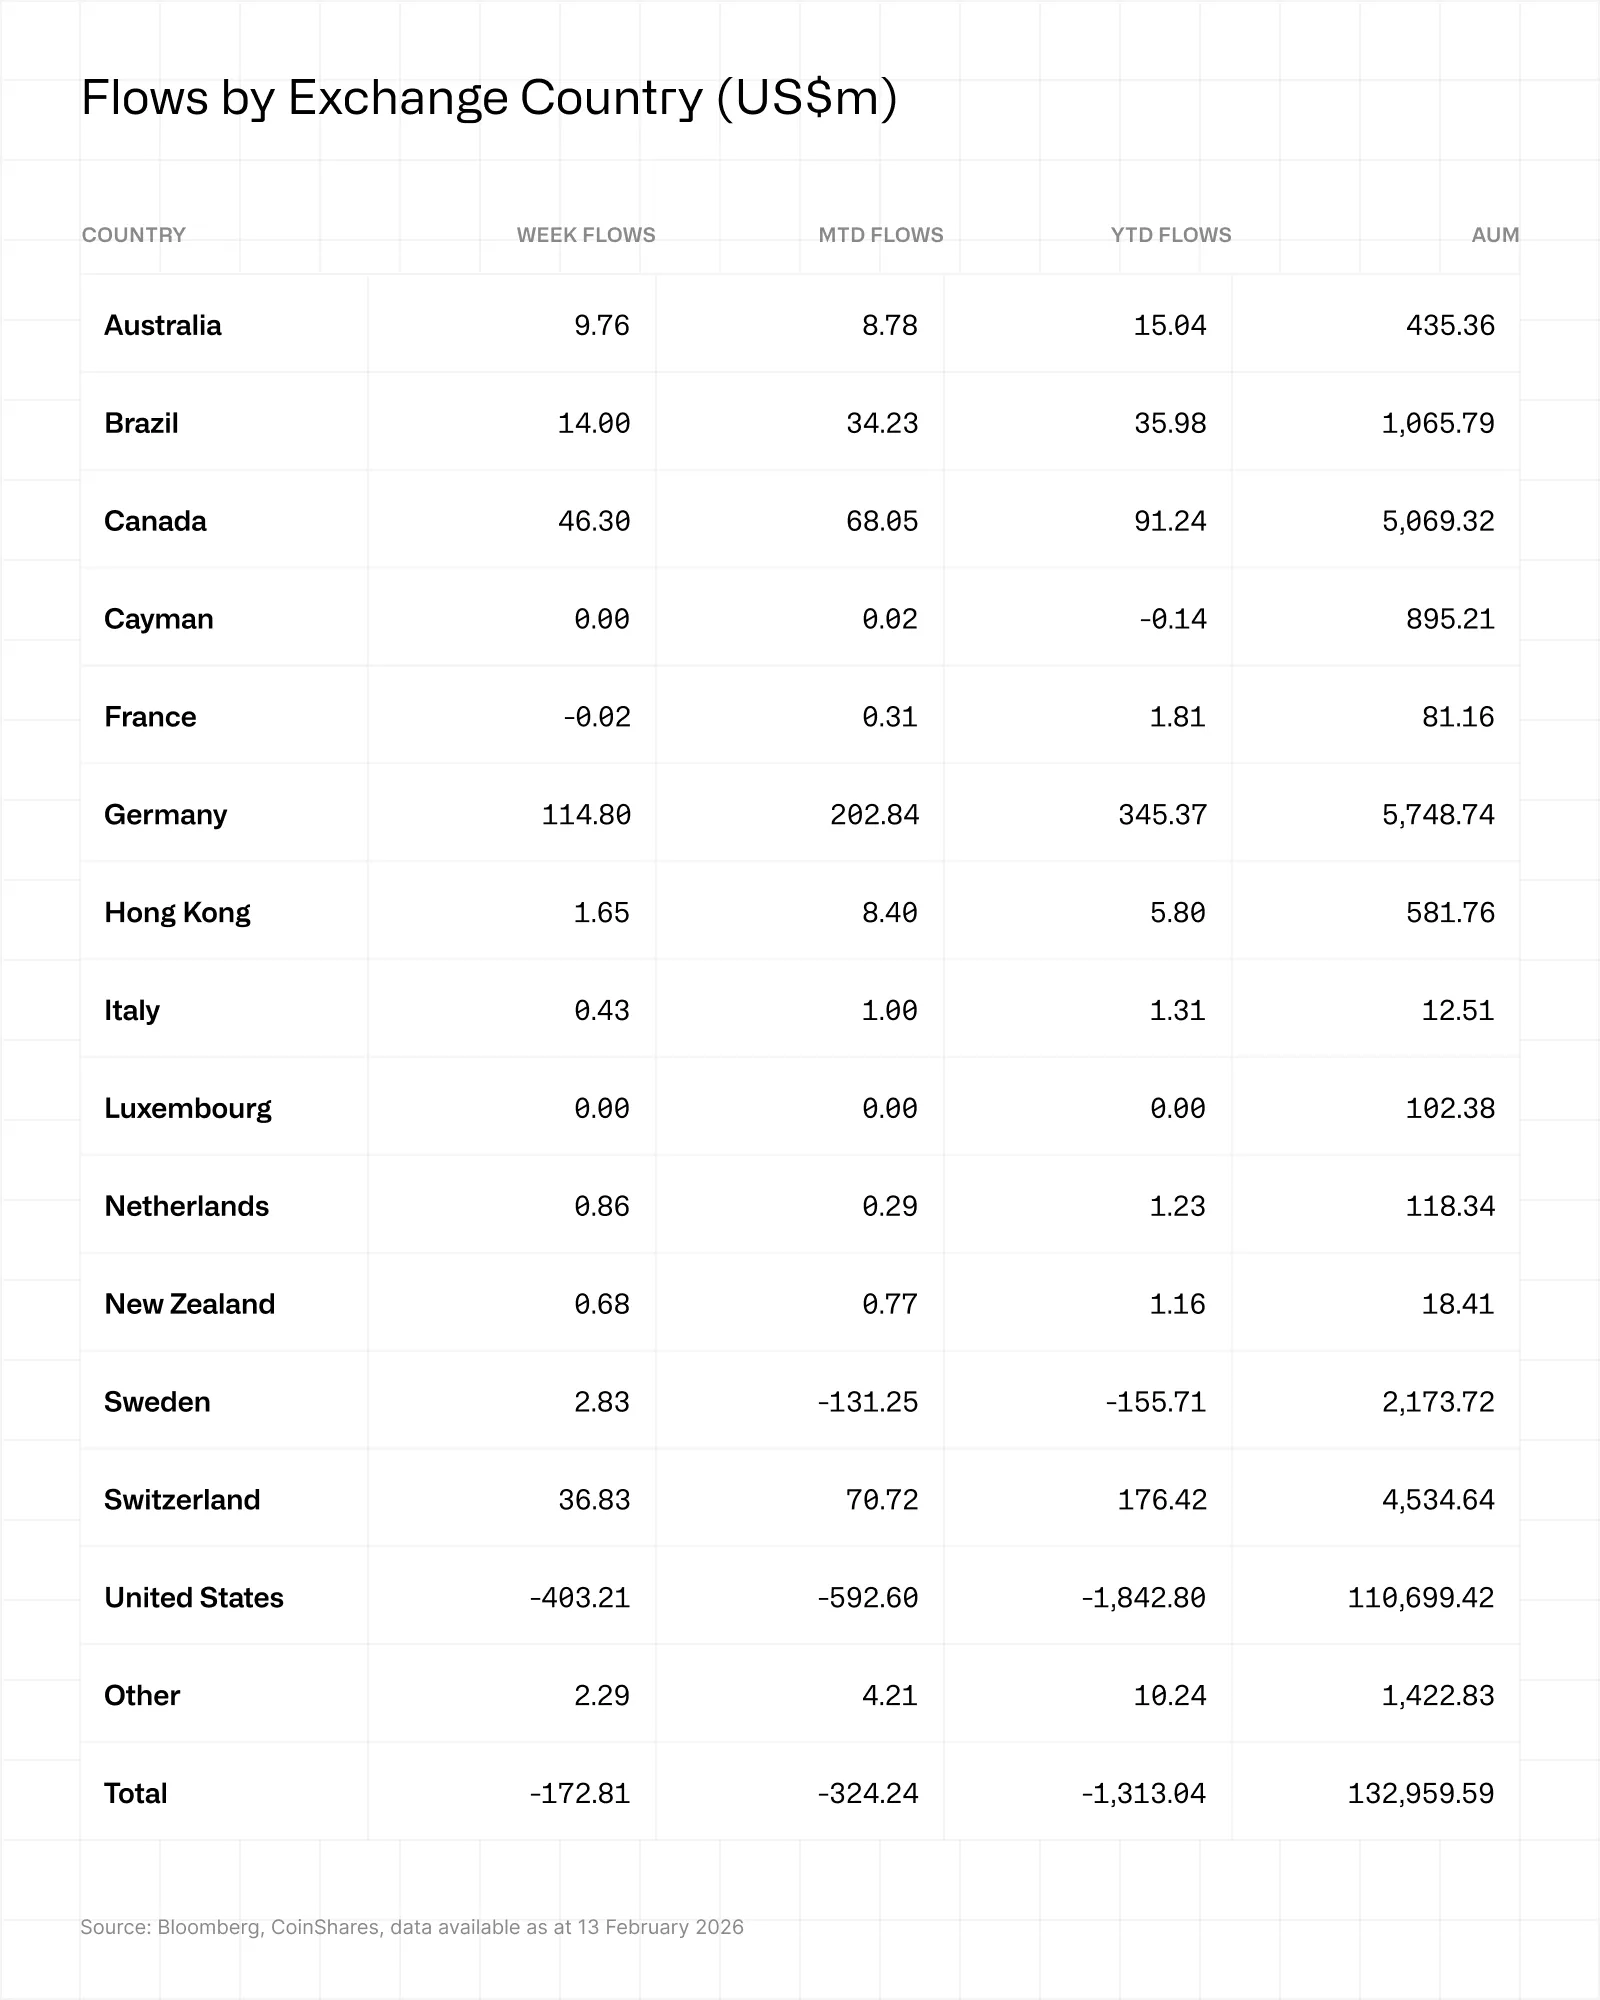
The United States led the sell-off with $347 million in outflows. On the other side, Switzerland ($19.5 million), Canada ($16.8 million), and Germany ($16.2 million) combined for $59 million in inflows — treating the price decline as a buying opportunity.
What this tells us is straightforward: there is no market consensus. U.S. institutional investors and their European counterparts are making opposite bets. The Americans are saying "reduce risk." The Europeans are saying "this is cheap." When the two largest pools of institutional capital disagree this sharply, two things tend to happen simultaneously: volatility compresses in the short term (as opposing forces cancel each other out), and the eventual resolution — when one side capitulates — tends to be swift and decisive.
This dynamic, as we'll see, is directly connected to what's happening on the chart.
A Methodological Note on Fund Flows
One caveat is worth stating explicitly. CoinShares tracks flows into digital asset investment products — funds, ETPs, trusts, and similar vehicles. These are not the same as spot market buy and sell orders.
The data is reported weekly, so it can't capture intra-week reversals. Different product structures translate inflows into actual asset purchases with varying time lags. And the available product universe differs by jurisdiction, limiting direct regional comparisons.
Fund flow data is therefore best understood not as a price prediction tool but as a preference signal. It tells you where people are actually putting money — which is more reliable than surveys or sentiment indices — but it doesn't guarantee that "inflow equals price increase." Especially when the inflow is modest ($3.5 million) and the overall environment is one of sustained withdrawal.
3. The Mechanics of Price Compression — Why $1.35 Feels Stuck
Having established the "no consensus" theme in fund flows, we can now see how that same dynamic manifests on the chart.
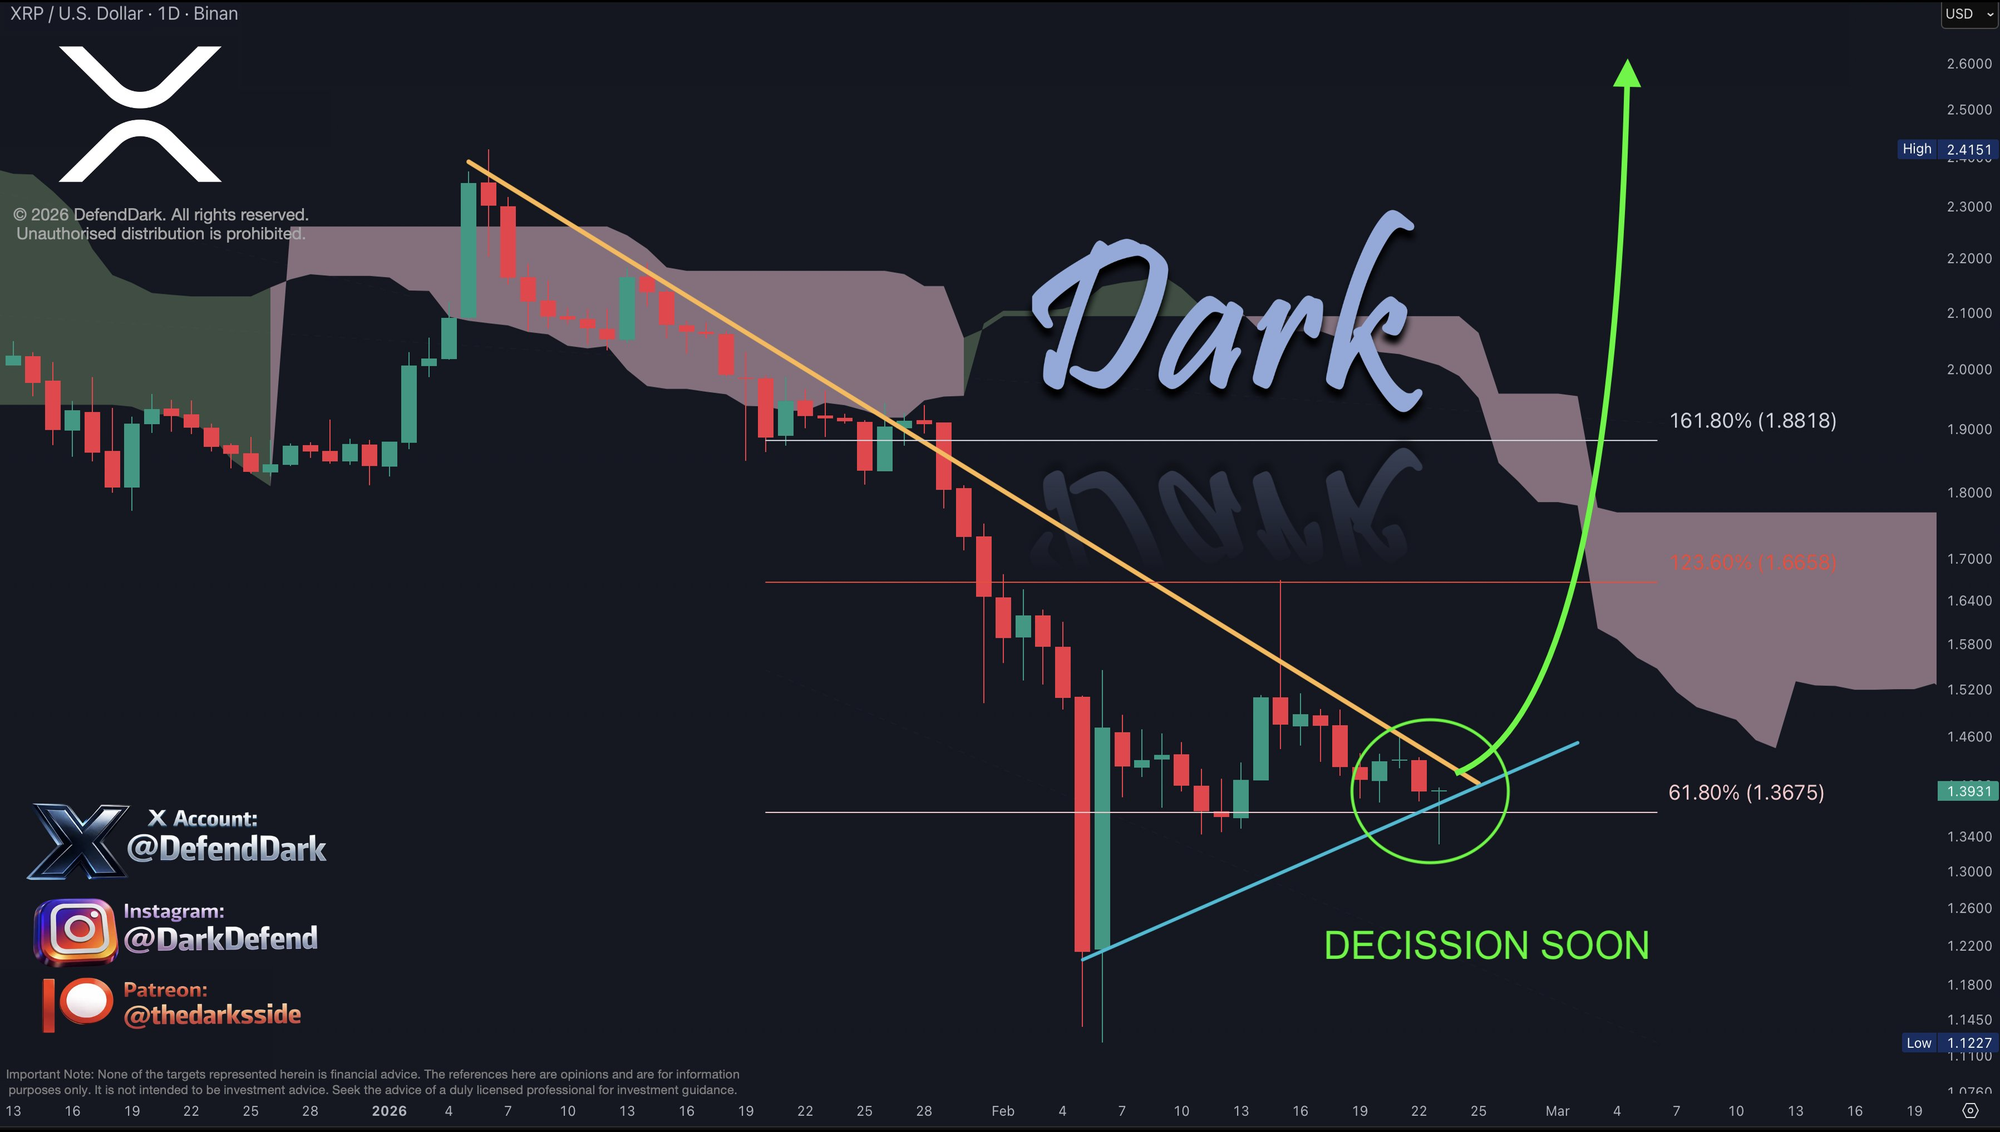
TheCryptoBasic, citing analyst Dark Defender, reports that XRP has entered a price compression zone on the daily chart — the range between a descending resistance trendline and an ascending support trendline is narrowing. The asset is "coiling."
How Compression Works
Price compression is a common pattern in technical analysis, but understanding the mechanics beneath it takes you beyond simple pattern recognition.
Compression occurs when both buyers and sellers are present, but neither side can overpower the other. Sellers create a ceiling ("I'll sell at or above this price"), forming a resistance line. Buyers create a floor ("I'll buy at or below this price"), forming a support line. Over time, these two boundaries converge. The trading range shrinks. Energy accumulates.
The coiling metaphor is apt: like a spring being wound tighter, the stored energy has to release eventually — and it tends to do so with force.
Here's the specific structure for XRP right now:
Resistance: A descending trendline originating from the January high of $2.41. Each time XRP has attempted a rally, this line has capped it. Its existence signals that the market still recognizes the broader downtrend.
Support: An ascending trendline originating from the February 5 low of $1.13 (closing price around $1.21). XRP has held above this line since then. On the day covered by the article, price dipped to $1.33 before bouncing — a failed attempt to break lower, which reinforces the support's near-term relevance.
What Happens When Compression Breaks — Historical Patterns
The critical point is that compression itself is directionally agnostic. The article makes this explicit: the break can go either way, and the outcome depends on prevailing sentiment and momentum.
When compression does resolve, three characteristics tend to accompany the move:
Velocity. The longer the compression, the faster the breakout tends to be. The article references the possibility of "rapid directional price swings." Think of it as stored kinetic energy: the longer it's contained, the more forceful the release.
Volume. Meaningful breakouts are typically accompanied by a notable increase in trading volume. If price moves but volume doesn't follow, the breakout's staying power is suspect. Given that overall crypto trading activity is already at a seven-month low, a volume surge would be particularly significant — and its absence particularly telling.
Retest. In genuine trend reversals, breakouts are often followed by a pullback that retests the broken level. If resistance breaks upward and the subsequent pullback finds support at the old resistance line, that's a textbook confirmation. If price immediately falls back into the prior range, it's likely a fakeout — and fakeouts are common during compression phases.
Dark Defender's Upside Roadmap — Used as a Map, Not a Destination
The article includes Dark Defender's upside scenario: Fibonacci extension targets at $1.66 (1.236 extension), $1.88 (161.8%), and $2.60.
These numbers are best treated not as predictions but as waypoints — levels where, if price moves upward, the market is likely to encounter resistance based on historical ratio relationships. They're the cartography, not the itinerary.
The same logic applies downward. If support breaks, the $1.13–$1.21 zone from the February 5 low becomes the next testing ground. Whether that zone holds will determine the next chapter.
What the chart ultimately tells us at this juncture is a single, important thing: "$1.35 feels stuck because it's supposed to feel stuck. This compression will end. The question is when and in which direction — and the chart alone can't answer that."
4. Anatomy of the $80 Narrative — A Lesson in Market Psychology
Now we arrive at the most provocative piece of the puzzle: the XRP $80 thesis.
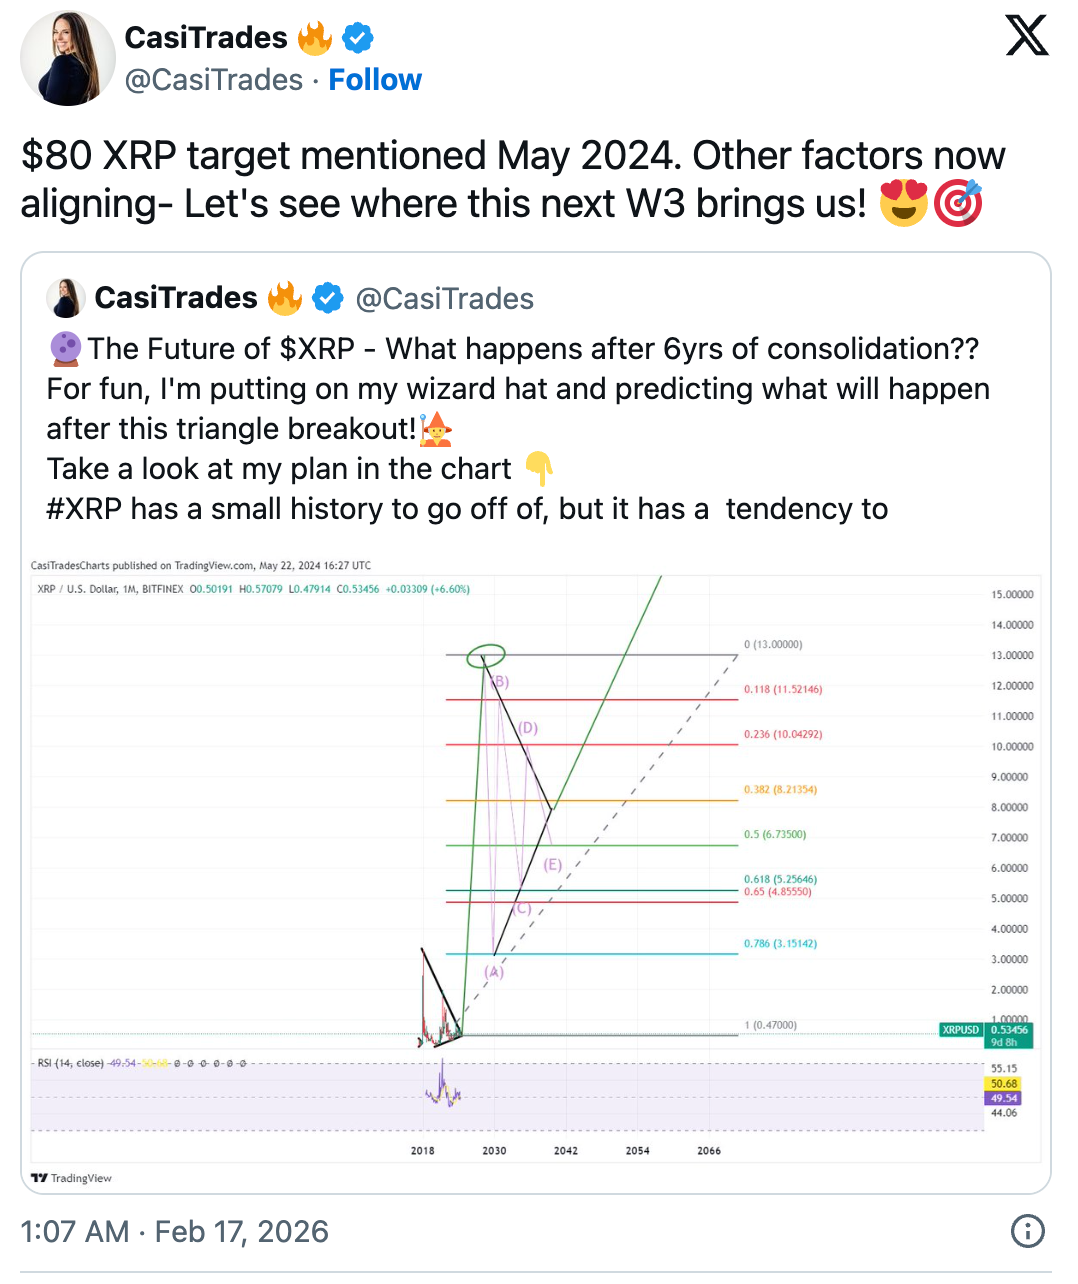
TheCryptoBasic reports that analyst CasiTrades has revisited a target she first introduced in May 2024, stating that "factors are now aligning" for a potential move toward $80. The same article, however, includes a crucial detail: she did not specify what those aligning factors are.
That single omission defines what this story actually is. It's not analysis in the empirical sense. It's narrative.
The Structure of CasiTrades' Thesis — And Its Track Record
🚨 Remember this: Once $XRP breaks its All-Time High, it’s uncharted territory. 🚀
— CasiTrades 🔥 (@CasiTrades) December 2, 2024
Extension targets like $8, $13, or even $80 are all on the table, but technical analysis becomes much tougher from there. With no historical levels left, we’ll rely solely on projections—and where…
Dismissing it outright would be a mistake, though. Here's why.
CasiTrades' framework is built on Elliott Wave theory. Her core argument: XRP spent six years (2018–2024) consolidating inside a massive symmetrical triangle. After breaking out of that triangle, extension targets of $8–$13 come into play, with $80 as a theoretical upper bound if the wave structure plays out fully.
In Elliott Wave terms, the most powerful rallies typically occur in the third wave (Wave 3). CasiTrades' reference to "where this next W3 brings us" sits within this context. The $80 figure isn't a near-term price call — it's a maximum extension target conditional on a specific long-term wave structure completing.
And this framework has a hit on its record. CasiTrades articulated this breakout thesis in May 2024, when XRP was trading at $0.53. By December 2024, XRP had rallied to $2.70 — roughly a 400% move — confirming the triangle breakout she'd anticipated. On the structural call, she was right.
Why This Time Is Different — The Liquidity Problem
The complication is that getting one call right doesn't guarantee the next one. And between then and now, the operating environment has changed materially.
Late 2024: Capital was flowing into the market. The post-Bitcoin ETF institutional cycle was in full swing. Regulatory optimism was high. XRP's technical breakout rode a wave of broad-based liquidity and sentiment. The sails caught wind.
February 2026: Capital has been flowing out for five straight weeks. Trading activity is at a seven-month low. Bitcoin and Ethereum have seen YTD outflows of $1.3 billion and $494 million respectively. The technical structure may be similar, but the liquidity environment underneath it is fundamentally different.
The analogy that works here: you can hoist the same sail, but if the wind has died, the boat doesn't move. CasiTrades' triangle breakout analysis describes the sail. Market liquidity is the wind. A well-designed sail is necessary but not sufficient.
Narrative Economics: Why $80 Is Circulating Right Now
There's a deeper question worth asking here, one that goes beyond whether $80 is technically achievable. Why is this particular number gaining traction at this particular moment?
Nobel laureate Robert Shiller's concept of narrative economics offers a useful lens. Shiller's argument is that markets are driven not only by data but by stories — and certain stories become "contagious" under certain conditions. They spread because they meet a psychological need, not because they're analytically superior.
The $80 narrative is contagious right now for three identifiable reasons.
First, prolonged price declines create demand for long-term stories. When you're holding an asset that's down 61% over five months, short-term analysis ("it might hit $1.40 tomorrow") offers no comfort. Only a big-picture narrative — "this could go to $80 someday" — makes the current pain bearable. This isn't analysis serving as conviction. It's narrative serving as a psychological safety net.
Second, price compression erodes certainty. As discussed in the chart section, compression removes velocity from the market. When nothing is happening, people lose their sense of direction. That void gets filled by the loudest story available — and big round numbers are always the loudest.
Third, past accuracy lends the narrative minimum credibility. The fact that CasiTrades called the 2024 breakout correctly gives $80 a veneer of legitimacy. Humans have a well-documented tendency to treat past success as evidence of future success (representativeness bias). One correct call doesn't predict the next, but narratives don't respect that distinction. They spread on pattern recognition, not statistical rigor.
The Right Way to Handle $80
Given all of this, the most productive use of the $80 figure is as follows:
Not as a target. It's a theoretical extension derived from a specific analytical framework, and the analyst herself labeled it a "projection, not a guarantee." Whether XRP ever reaches that level depends on a constellation of variables — liquidity, regulation, macro environment, market structure — and no concrete evidence has been presented that these variables are currently aligning.
As a psychological data point. The fact that $80 is circulating again tells us something real about the market's emotional state. The appetite for long-horizon narratives is high, which inversely means short-term conviction is low. That's useful information in its own right.
As a conditional framework. Reframing "Can XRP hit $80?" as "What would need to be true for the path toward $80 to open?" converts an emotional question into an analytical one. And the answer, based on everything we've covered, is clear: you'd need the compression to resolve upward, the breakout to be confirmed by retest, fund flows to accelerate (not just persist), and the broader market's risk-off posture to reverse. None of those conditions are currently met.
5. Where the Three Signals Intersect
We've now walked through all three layers. Let's overlay them.
Capital (Liquidity): Five consecutive weeks of outflows totaling $4 billion. Trading activity at a seven-month low. But XRP maintains positive flow (YTD $151 million). Regionally, U.S. selling vs. European buying — no consensus.
Structure (Chart): XRP is in a compression zone between descending resistance and ascending support. A downside test at $1.33 was rejected. Compression signals impending volatility, but direction remains undetermined.
Psychology (Narrative): The $80 thesis has resurfaced. It's spreading on psychological demand more than analytical evidence. Past accuracy provides minimum credibility but doesn't account for changed conditions.
Cross-referencing these three layers, the current state of XRP converges on a single statement:
"The market has lost direction, but selective interest in XRP persists. For that interest to translate into price action, the compression must resolve and the liquidity environment must shift — simultaneously."
This is neither a bullish call nor a bearish one. It's an observation that all three layers are pointing to the same thing: "Not yet decided." And the fact that it's not yet decided is itself important — because indeterminate states don't last forever.
6. The Conditions That Would Change the Calculus
The conclusion here isn't a price forecast. It's a set of markers — things to watch that, once confirmed, would meaningfully alter the picture.
Condition 1: Flow Continuity and Environmental Shift
Whether XRP keeps attracting inflows is the first variable. But you can't watch XRP in isolation. Three scenarios are in play:
Scenario A: XRP inflows continue and overall market outflows decelerate. → This would be an early signal that the market is finding a floor. XRP's selective inflows would begin to look like a leading indicator.
Scenario B: XRP inflows continue but overall outflows persist. → This suggests decoupling, but its sustainability is questionable. Selective inflows eventually hit a ceiling when total market liquidity keeps shrinking.
Scenario C: XRP inflows reverse. → The selective buying thesis is exhausted. Downside pressure likely increases.
Next week's CoinShares report will point toward one of these three paths.
Condition 2: How the Compression Resolves — Shape Over Direction
The compression will break. What matters more than which direction it breaks is what happens afterward.
If it breaks upward: $1.66 is the first checkpoint. Watch whether the subsequent pullback finds support near the old resistance line. If it does, that's a textbook trend-reversal signal. If price falls straight back into the prior range, it's a fakeout.
If it breaks downward: The $1.13–$1.21 zone gets retested. The key variable is recovery speed. A quick bounce (within one to two days) suggests the downside lacks conviction. A slow, grinding stay below support suggests a new leg down.
In either case: The first candle is noise. The second and third candles are signal. Compression phases are notorious for producing fakeouts in both directions before the real move emerges.
Condition 3: The Limits of XRP's Independence
In an environment where the broader market has seen five straight weeks of outflows, it's structurally difficult for any single asset to sustain an independent uptrend. Cross-asset correlation tends to decrease when liquidity is abundant and increase when liquidity contracts. We're in a contracting liquidity environment, which means that even if XRP's individual picture looks constructive, a broader market selloff would likely drag it along.
This is why monitoring XRP in isolation isn't enough. Bitcoin's price action, total crypto market capitalization, aggregate trading volume, and DeFi TVL all provide context for whether the environment is becoming more or less hospitable to the kind of move XRP's chart structure would need.
Conclusion: Reading Ambiguity, Not Enduring It
XRP at $1.35 is a frustrating price. But what this analysis reveals is that the frustration has structure.
The market is in risk-off mode, but selective interest in XRP remains. The chart is coiling toward a decision point. Psychology is reaching for big numbers to fill the void. All three layers point to the same verdict: not yet resolved. And unresolved states are, by definition, temporary.
What's needed now isn't a forecast — it's a framework. Is fund flow continuity holding? How does the compression resolve, and what shape does the aftermath take? Is the broader liquidity environment shifting? When these three conditions confirm simultaneously, that's when the picture changes.
Until then, the most practical stance isn't to endure the ambiguity. It's to read it.
This article is for informational purposes only and does not constitute investment advice.
Sources
Primary Sources (Original Data & Analyst Posts)
| # | Source | URL |
|---|---|---|
| 1 | CoinShares Weekly Digital Asset Fund Flows Report (week ending Feb 23, 2026) | https://coinshares.com/us/insights/research-data/fund-flows-23-02-26/ |
| 2 | CasiTrades — Initial $80 target discussion (May 2024) | https://x.com/i/status/1793325631528132646 |
| 3 | CasiTrades — Extension targets post-ATH breakout (Dec 2024) | https://twitter.com/CasiTrades/status/1863656396262346868 |
| 4 | CasiTrades — "Factors now aligning" follow-up (Feb 16, 2026) | https://twitter.com/CasiTrades/status/2023428940245938195 |
| 5 | Dark Defender — XRP compression analysis (Feb 23, 2026) | https://x.com/DefendDark/status/2025891544683716923 |
Secondary Sources (Articles Directly Referenced)
| # | Title | URL |
|---|---|---|
| 6 | XRP Continues Posting Inflows as Crypto Funds See $288M in Fifth Straight Week of Outflows | https://thecryptobasic.com/2026/02/23/xrp-continues-posting-inflows-as-crypto-funds-see-288m-in-fifth-straight-week-of-outflows/ |
| 7 | XRP Decision Time Looms as Price Reaches Crucial Point | https://thecryptobasic.com/2026/02/23/xrp-decision-time-looms-as-price-reaches-crucial-point/ |
| 8 | Future of XRP: Analyst Says Factors Now Aligning for the XRP $80 Target | https://thecryptobasic.com/2026/02/23/future-of-xrp-analyst-says-factors-now-aligning-for-the-xrp-80-target/ |
Tertiary Sources (Cross-Referenced Within Articles)
| # | Title | URL |
|---|---|---|
| 9 | Again, XRP Defies Market Slump with Fresh Inflows as $173M Exits Crypto Funds | https://thecryptobasic.com/2026/02/16/again-xrp-defies-market-slump-with-fresh-inflows-as-173m-exits-crypto-funds/ |
| 10 | XRP Stands Strong with Biggest Weekly Inflow While Bitcoin Bleeds $264M | https://thecryptobasic.com/2026/02/09/xrp-stands-strong-with-biggest-weekly-inflow-while-bitcoin-bleeds-264m/ |
| 11 | XRP Down 60% from ATH — Is This the Best Buy Opportunity Before $10? | https://thecryptobasic.com/2026/02/19/xrp-down-60-from-ath-is-this-the-best-buy-opportunity-before-10/ |
| 12 | Analyst Anchors His Conviction on XRP Hitting $8–$13 and Ultimately $27 | https://thecryptobasic.com/2026/02/18/analyst-anchors-his-conviction-on-xrp-hitting-8-13-and-ultimately-27/ |
| 13 | All Roads Lead to Rome: Analyst Expects XRP Triangle Breakout to Push to $27 | https://thecryptobasic.com/2025/12/04/all-roads-lead-to-rome-analyst-expects-xrp-triangle-breakout-to-push-to-27/ |
| 14 | Everyone is Panicking But XRP Pumped 835% Last Time This Happened: Chartist | https://thecryptobasic.com/2026/02/23/everyone-is-panicking-but-xrp-pumped-835-last-time-this-happened-chartist/ |
Academic / Conceptual Reference
| # | Reference | Note |
|---|---|---|
| 15 | Robert Shiller, Narrative Economics: How Stories Go Viral and Drive Major Economic Events (Princeton University Press, 2019) | Applied in Section 4 to analyze why the $80 narrative gains traction during periods of price compression and prolonged drawdowns |
![[마켓 분석] 비트코인 8만 달러 앞에서 멈춘 시장](https://storage.ghost.io/c/8c/af/8caf2296-06bf-4501-ae99-5e72cb676b76/content/images/size/w600/2026/04/63d9df35-5d28-48fe-9a7a-3f651c82aafe.png)